Every network administrator has to optimize their network and monitor the network devices present. If you wish to keep track of your network thoroughly, netpath is definitely a feature that you should be looking forward to implementing in your network. Packed inside the infamous Network Performance Monitor, a tool developed by SolarWinds which gives you the ability to monitor your network performance thoroughly, NetPath is a basically a graphical version of your typical traceroute. Traceroute is a really neat tool that allows you to see how the packets in your network are being transmitted from the host machine to the target.
NetPath and Visual TraceRoute
First things first, let us discuss the working of traceroute before getting into further details. Basically, traceroute works on the mechanism of TTL or Time to live. The working procedure is rather simple. When you are communicating with a device on a network, you are essentially sending packets that are being received by the target. During this, the packet can hop around different devices before finally reaching the target. Traceroute assigns a TTL value to each packet as it leaves and the value is decremented each time it reaches a router which directs it to a different router and in the end, the packet reaches the target machine. When a packet reaches a certain router, the TTL value is decremented and the device sends back a ping to the host. This ping is used by traceroute to find the identity of the device. This helps you in visualizing your network. Now, traceroute is a command-line tool so there are no visuals and you have plain text to work with. However, that changes with NetPath. With the help of NetPath, you are able to visualize this said traceroute and instead of plain data, you can actually see a graph of the network which is way more convenient than your generic methods. This is how NetPath gains an upper hand on your normal traceroute techniques and every network admin should opt for it.
Installing Network Performance Monitor
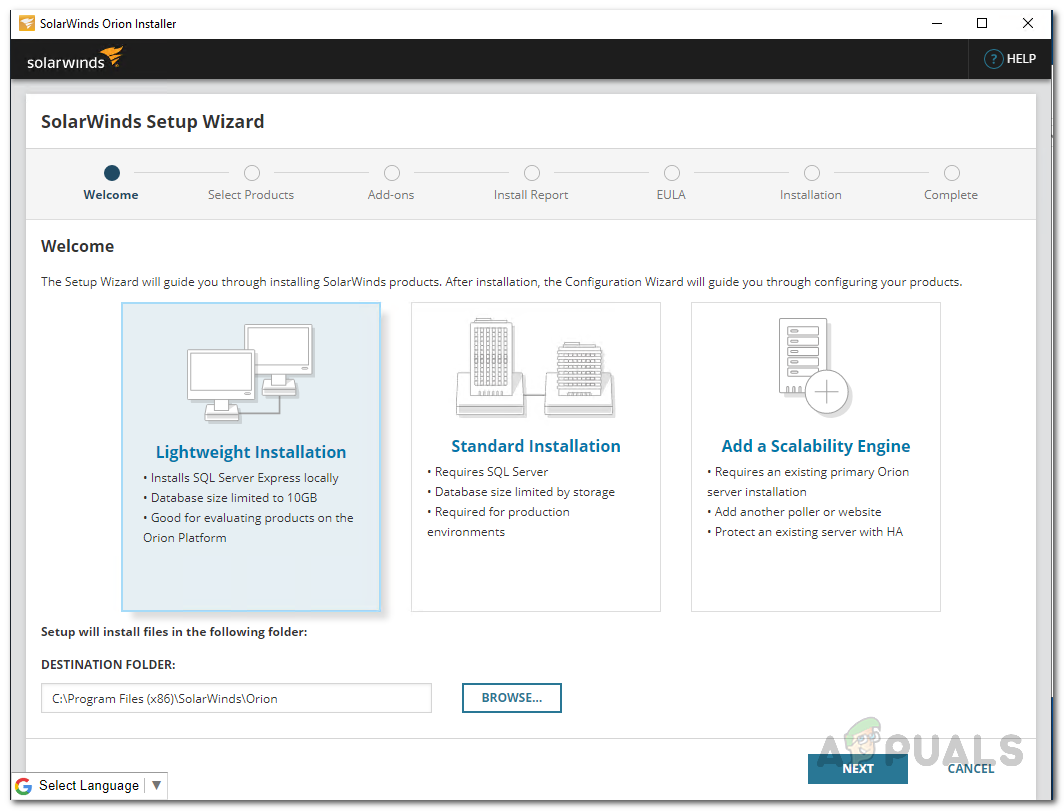
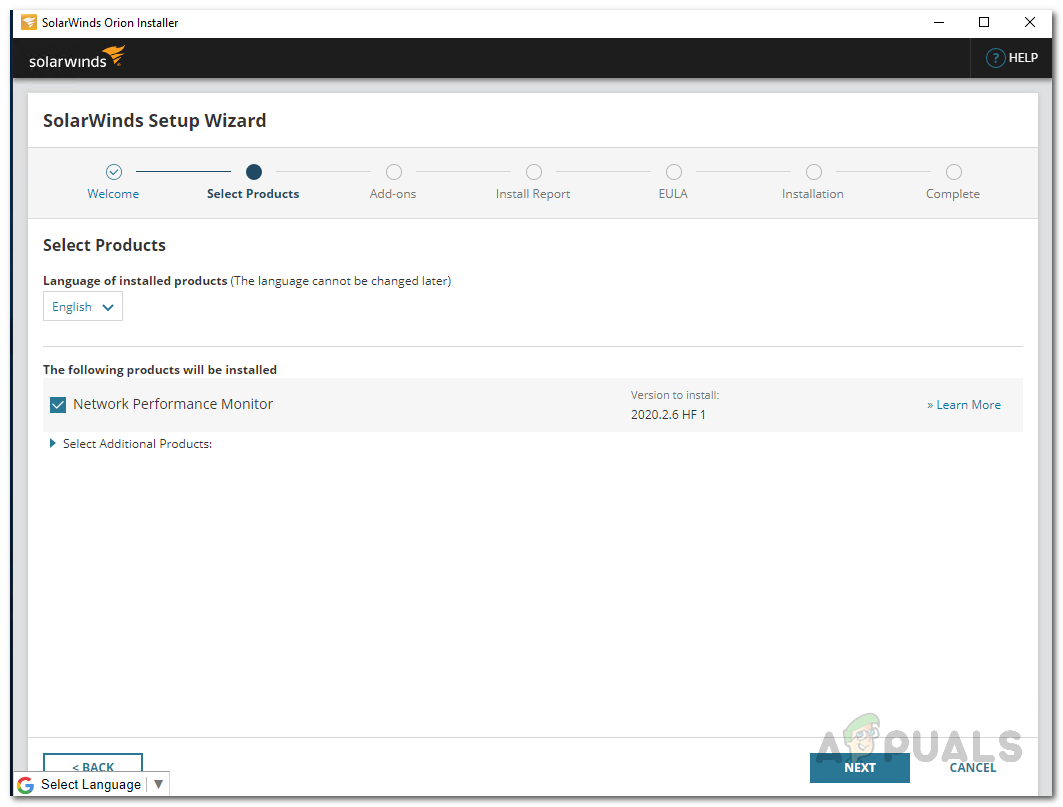
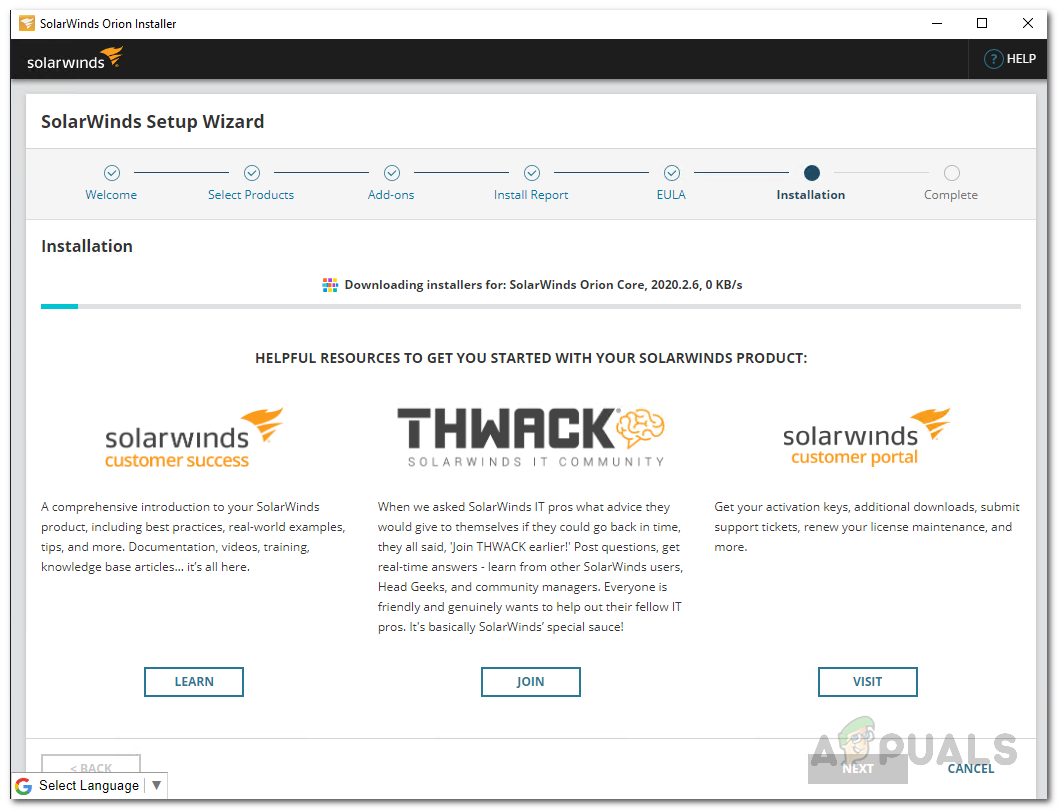
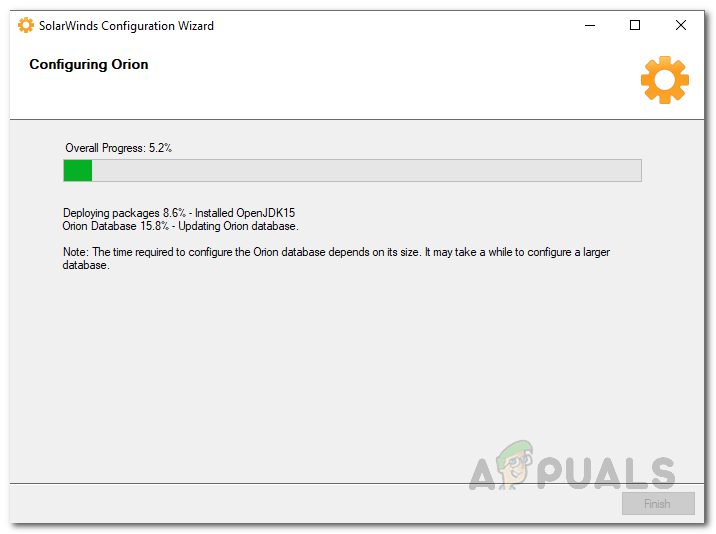
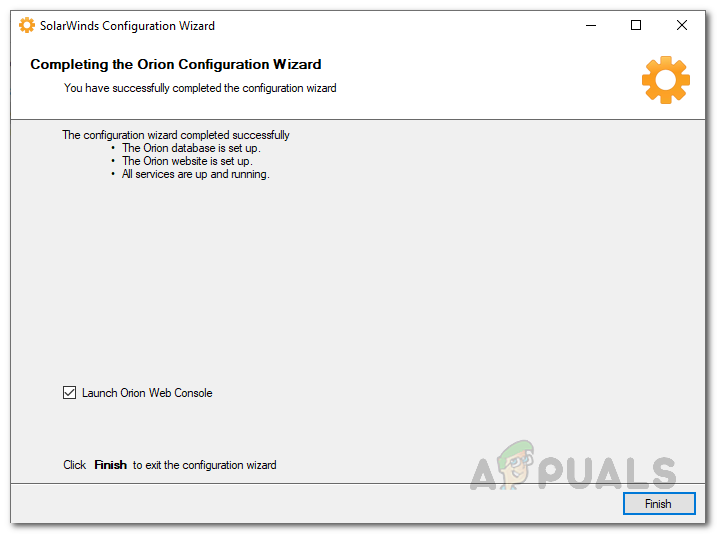
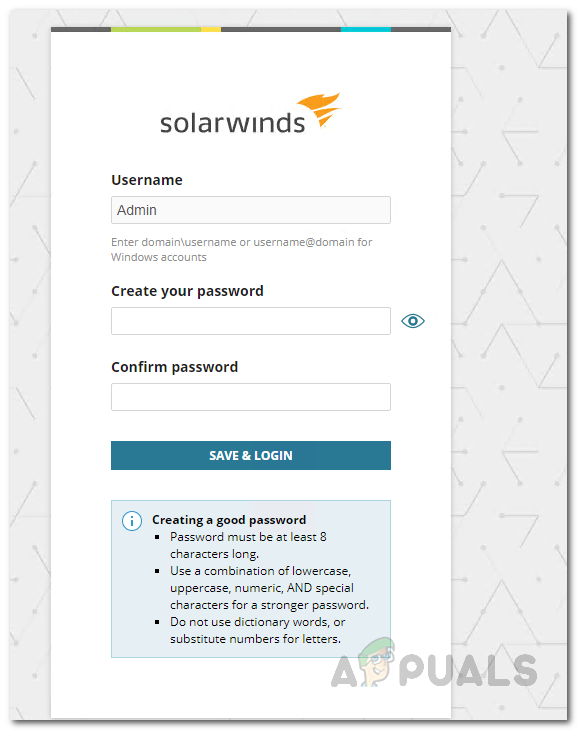
As we have mentioned, NetPath is one feature from the long list of features that come with the Network Performance Monitor by SolarWinds. The SolarWinds name is no stranger to network admins and they have gained a huge reputation for themselves due to the high quality products. NPM is no exception here and we do have a comprehensive NPM review that will explain your whys. In order to be able to use NetPath, you will first have to install NPM. To do this, go ahead and download the tool from this link. Once you have downloaded the tool, you will find yourself with the Orion installer. Follow the instructions given down below to install NPM:
Create NetPath Service
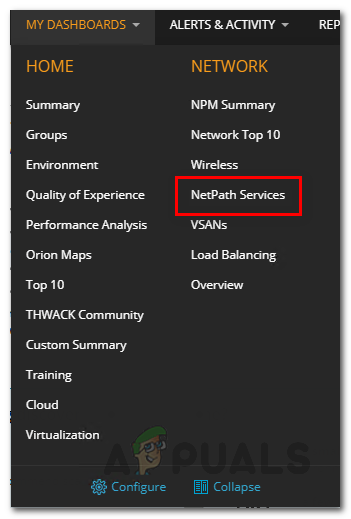
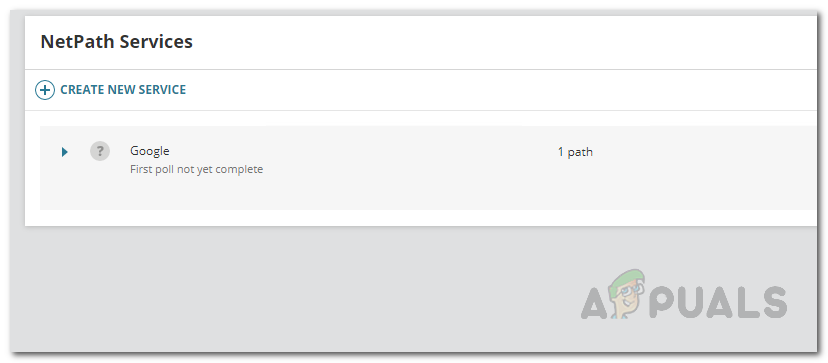
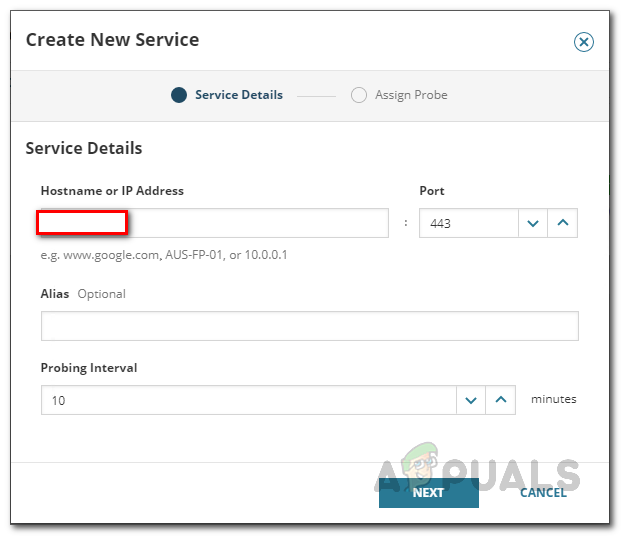
To start using NetPath and take advantage of a visual traceroute, we will first have to create a service. A service is basically the destination device to which you want a map. We recommend deploying these services for the applications that are really important. NetPath services are essentially monitored by probes. To create a service, follow the instructions given down below:
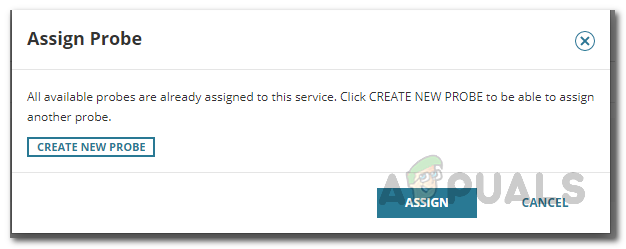
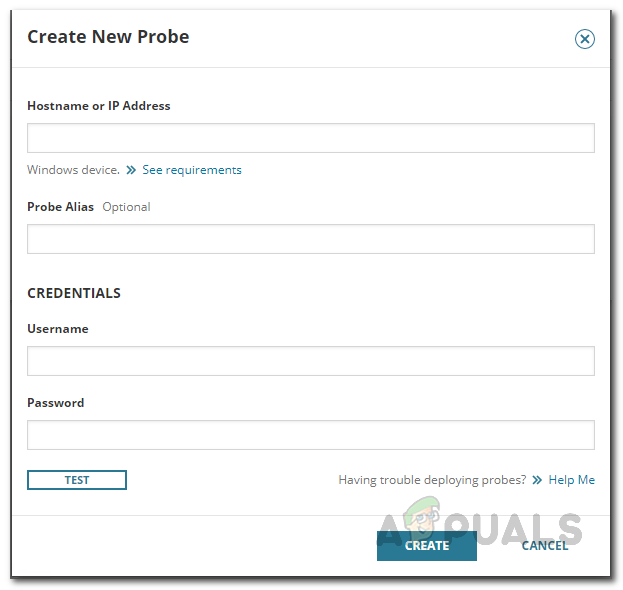
Create a NetPath Probe
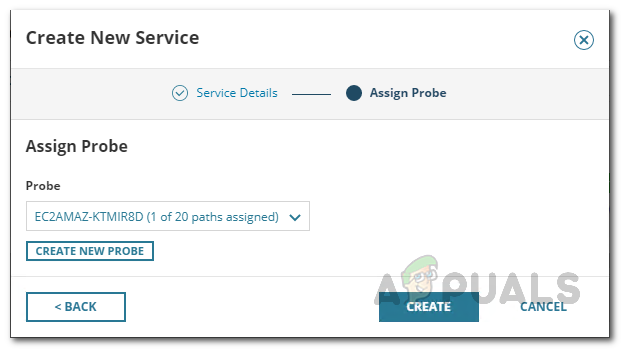
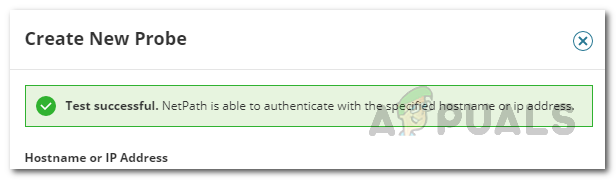
As it turns out, a probe is basically the source or the starting path that you are testing the application from. To make it easier, you can simply think of a probe as a user. It is best to deploy probes on the applications where you have users. Follow the instructions given down below to create a probe:
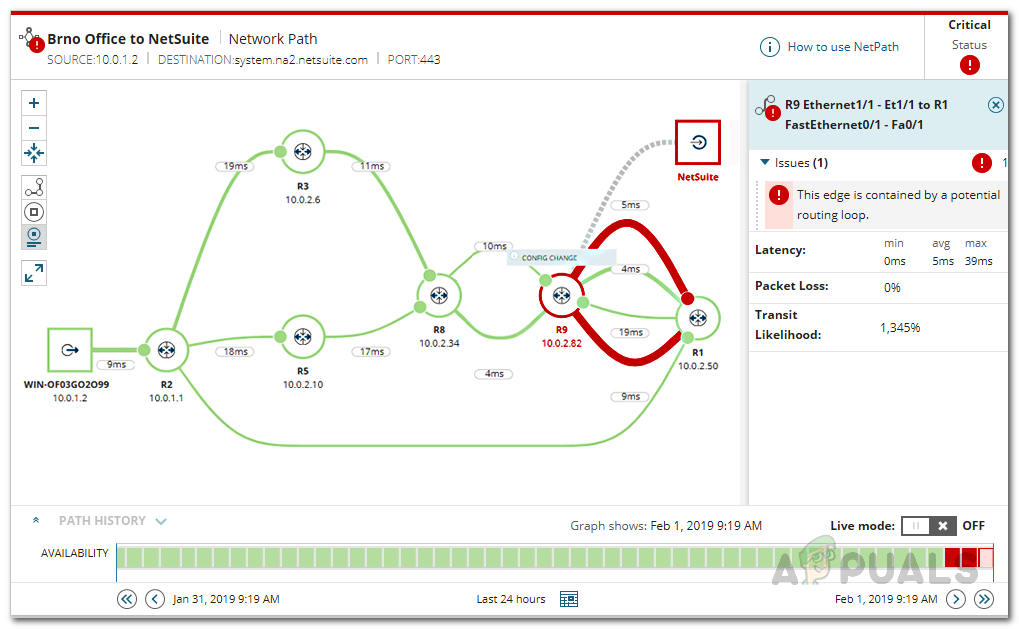
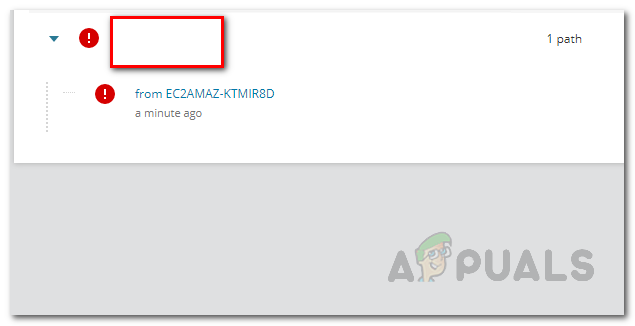
Viewing Visual TraceRoute
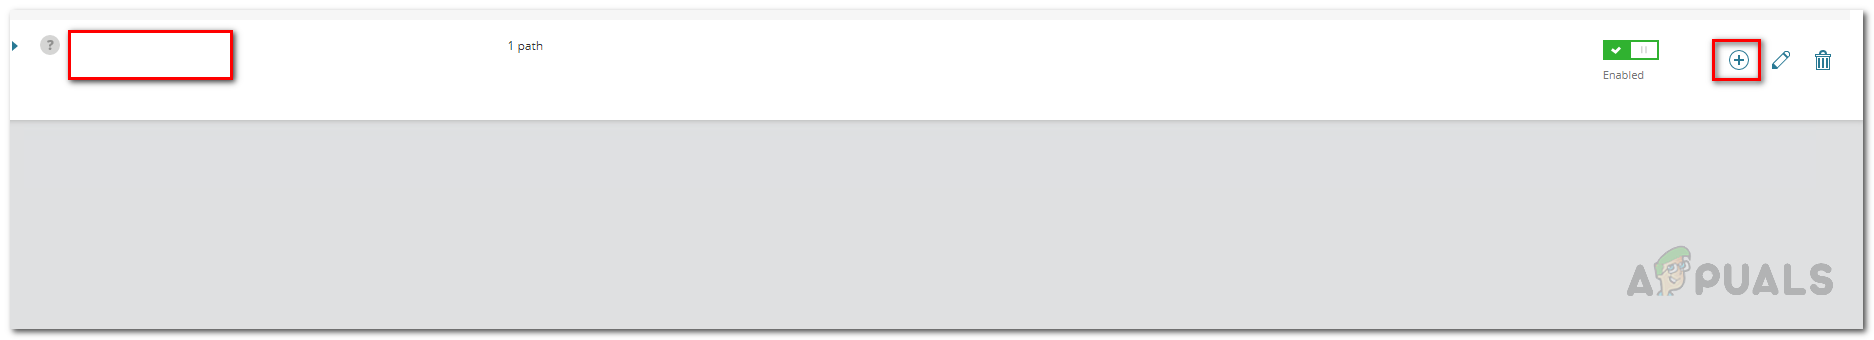
Now that we have successfully created a service as well as probes to monitor it, you are ready to view the visual traceroute of the service. On the left-hand side, you will see the probe or the starting path whereas the destination device resides on the right-hand side. The the transit is basically everything that is in the middle. To view the network path, follow the instructions given down below:
What is Traceroute and How to use Traceroute NG?What is ’traceroute’ and How to Use It?Microsoft Visual Studio Code Editor Official Build Latest Version Available For…The 5 Best Traceroute Alternatives for Connection Path Analysis