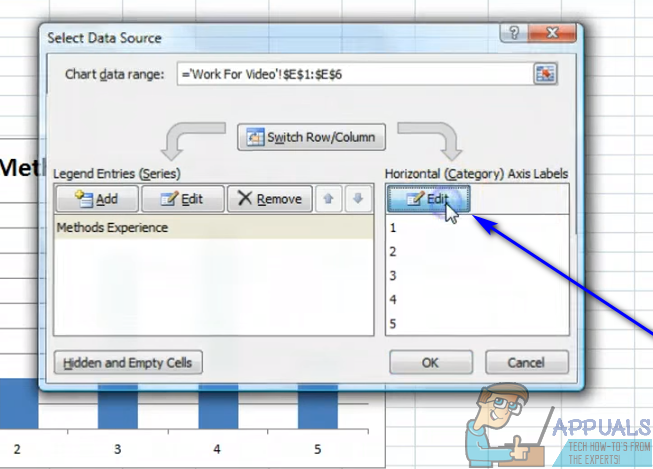
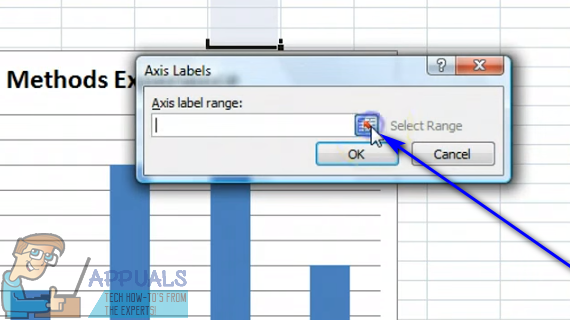
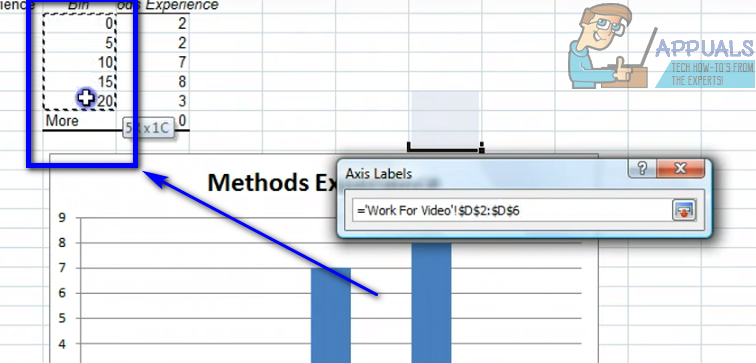
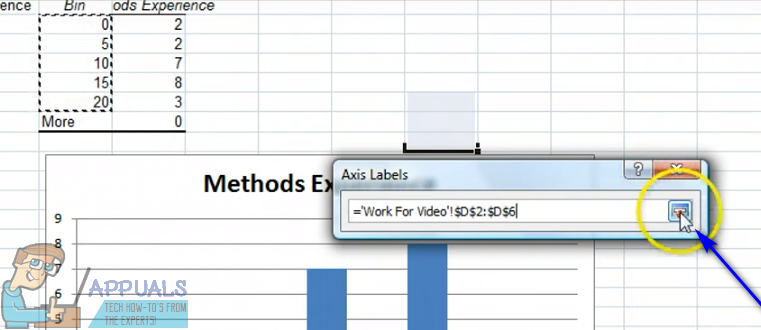
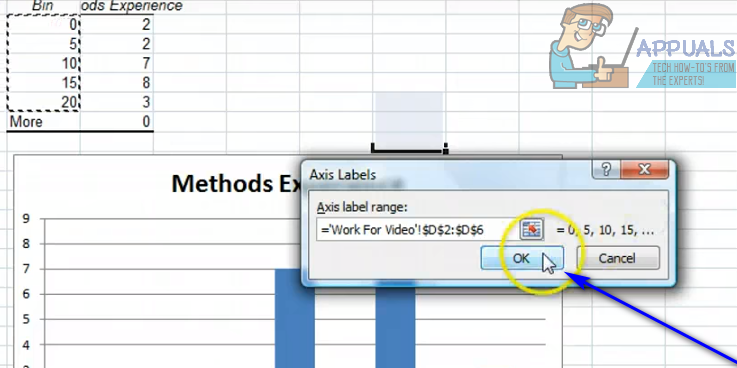
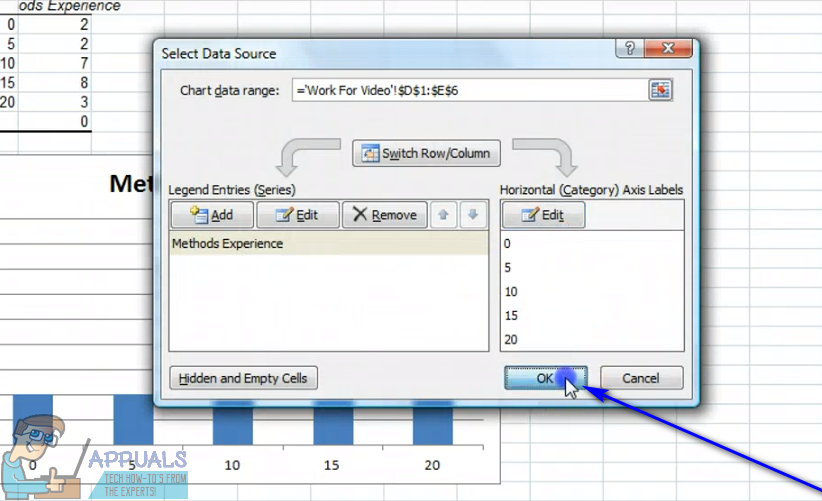
Almost all of the different kinds of graphs and charts Excel has to offer to users have one thing in common – they have both an X axis and a Y axis. The two axes of a graph or chart are used to plot two different categories of data points. When you create a graph on Excel, you can specify the set of values you want to see on the Y axis and the set of values you want to see on the X axis. In some cases, however, the user ends up creating the graph and then wanting to change the values of, say, the X axis afterwards. Thankfully, that is completely within the realm of possibility. It is entirely possible for a user to change the values of the X axis on a graph in an Excel spreadsheet to a different set of values in a different set of cells on the spreadsheet. In addition, the process you need to go through to change the values of the X axis in a graph in Excel are quite similar on all versions of Microsoft Excel. If you would like to change the set of values the X axis of a graph in Excel has been plotted using, you need to: While the steps listed and described above are intended to be used to change the values of the X axis of a graph in Excel, pretty much the same steps can be used to change the values of the Y axis of a graph in Excel – all you’ll have to do is right-click on the Y axis of the graph in step 2 instead of the graph’s X axis.
How to Add Axis Labels in Microsoft ExcelHow to Change the Name of a Sheet Within an Excel FileHow to Perform Subtraction in ExcelHow to Calculate the Square Root of a Number in Excel